RESEARCH

Friday, September 16th, 2011

Green Light: Barcelona ’92

This diagram needs labels…. the red circles are the Olympic venues, scaled in proportion to their seating capacities.  The red arcs are all coming from the Olympic Village (which is green, but barely visible) and they are weighted in proportion to the % of athletes traveling to the different venues.


Barcelona is said to have hosted the most successful Olympic Games to date, and the city has been living it up since 1992.  This is because the urban development necessary to support the mega-event was distributed in such a way that revitalized the whole city: there were four main zones for the events to take place, one at each entrance to the city.  These are all connected by the main ring road, the construction of which was accelerated to completion for the purpose of getting 21,600 members of the Olympic Family (athletes, trainers, event officials, special guests, groupies) where they needed to be on time for every event.  Not to mention the several million spectators flooding the city to watch the Games.  The strategic placement of the Olympic Village near the waterfront brought back to life a previously derelict urban facade.  The beaches had been cut off from the rest of the city by train tracks and highways until preparation for the Games moved these routes underground to open up the coastline.



Friday, September 16th, 2011

RPI in the Olympics

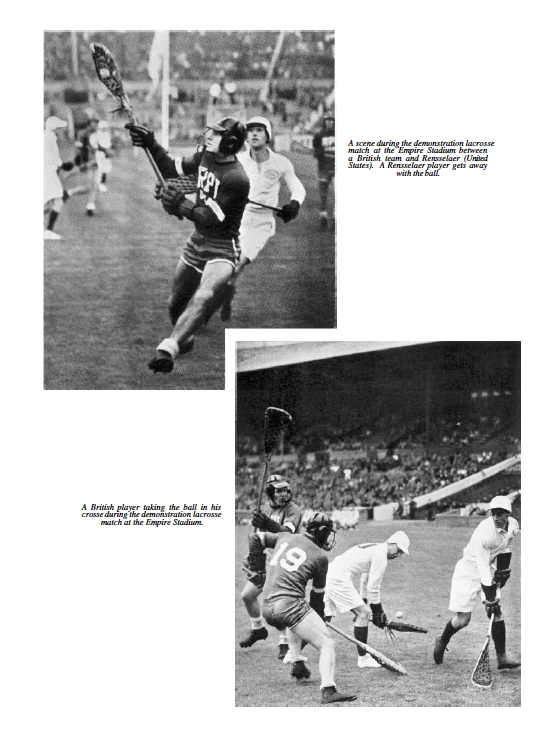
This is from the 1948 Olympics in London where lacrosse was played as a "demonstration sport".

From the IOC Report:

The organisation of the Lacrosse Demonstration was carried out by the English Lacrosse Union and this body invited a team from the United States of America to play a match at the Empire Stadium against an All-England Lacrosse side. The visiting team was the Rensselaer Polytechnic of Troy, New York State. The U.S.A. team had carried out a tour in Great Britain, and concluded this with the fitting finale of the match at Wembley. The modern game of lacrosse is believed to have originated from a tribal game known as ” ball game ” of the North American Indians and was brought to England by the settlers in Canada in the 18th or 19th Century. It is played not only in Great Britain, but also in Australia and Canada and, most prominently of all, in the United States of America.

The teams at Wembley proved to be excellently matched, and the resulting game was both close and exciting, in addition to being one of the best exhibitions of lacrosse ever seen in England. During the first quarter (the game consists of four 20-minute periods), Whittaker opened the scoring for the English side, but the Americans soon asserted themselves and went away to a 4-1 lead with goals by Coleman, Myers (2) and Wood. Before the end of the period, however, Little had reduced the margin. An Exciting Finish There was no such goal-scoring rush in the second and third periods, a single goal by Wilson, which reduced the margin to one goal, in the second period, being the only score. The English team, however, turned on full pressure at the start of the final twenty minutes and first Whittaker equalised with a brilliant goal, and then Dennis put them ahead. It seemed likely that they would hold their lead, for the defence was now closely knit, but, in a most exciting finish, Myers put the Americans on level terms with only three minutes left for play.


Friday, September 16th, 2011

Olympic Venue Layout Typology


Our current research involves us mapping every venue from every Summer Olympic Games. From there we can layer information such as infrastructure and population density to understand the various factors which drive the location of different venues. We are also looking at establishing a catalog of venue layouts. For instance, Helsinki in 1952 shows a central layout with single direct routes to venues outside of the immediate city. Mexico City in 1968 shows an interconnected web of venues, while the upcoming 2012 Games in London show how the Games have grown to envelope an entire country.


Friday, September 16th, 2011

Great original source documents

http://www.la84foundation.org/5va/reports_frmst.htm


Here’s a great site that has links to the original IOC reports concerning each and every Olympic Game. These are the documents that every Wikipedia article sites. They are incredible as source documents. Especially interesting is to critically evaluate the way each nation characterizes (or tries to) their approach to planning and executing the games. A great example is Stockholm in 1912: organizers called for a scaled down Olympics which was less expensive and expansive than the 1908 London Games, but when the Swedes tried to pare down the number of events, countries who were particularly strong in those events lobbied for their inclusion. In the end, the games were larger and more expensive, but not necessarily because of the Swedes.


Friday, September 16th, 2011

GAMES EVOLUTION [olympic sports]

GAMES evolution

Friday, September 16th, 2011

Sports Journalism as Insight to Bias and Perspective in Event Coverage

http://img.ezinemark.com/imagemanager2/files/30004252/2011/05/2011-05-27-16-35-56-10-tiger-woods-choked-up-after-winning-the-2006-briti.jpeg
Sports journalism seems to be the journalism which accepts its story-telling roles and partnerships with advertising and entertainment. Yet it still suggest that cultural and moral values are alluded in sports reporting.
The implication that sports reporting emphasizes storytelling and plot over impartial truth telling  isparticularly interesting in contrast to other forms of journalistic endeavors . For sports journalists, there seems to be a sense that what is being reported is of personal interest, which knowingly or unknowingly creates a tone in their writing. Sports journalism seems to go further then coverage and analysis, it perpetuates the need for personal interaction and involvement in the “big picture”. 
This form of information retrieval and distribution is particularly fit for world events such as the World Cups, the Olympics, the Commonwealth Games, the Tour de France, etc. It openly presents a speculative narrative with particular known biases which are used to the advantage of the writer and reader. An American journalist reporting about the Olympics would be report to the american people with an American biases, yet there is the distinct attempt to locate/discover the larger understanding of the event in context with the world and its parts (other countries, societies, and/or cultures).

Friday, September 16th, 2011

Event/Coverage/Audience Cycle

Event coverage is naturally subject to bias. Here, “The Event” is seen not as a single node from which coverage is emanating from, but a cyclical event from which future events, perception, and coverage change due not only to each other, but cycles of events in the past as well. Thus, in order to understand an event and resultant reactions, you must understand previous events and reactions. Furthermore, it becomes important to speculate how an event and coverage will affect future events and coverage.

Inherent in this speculation is the relationship between (1) the Event, (2) what those people or groups providing the news coverage think (generally and specifically about event), (3) What is actually reported as the event news coverage, and (4) what the audience of the news coverage think about.

As this drawing suggests, the way something (in this case, the event) is covered is linked to how the audience thinks through the control coverage has on what the audience thinks about.


Friday, September 16th, 2011

Olympic Broadcast

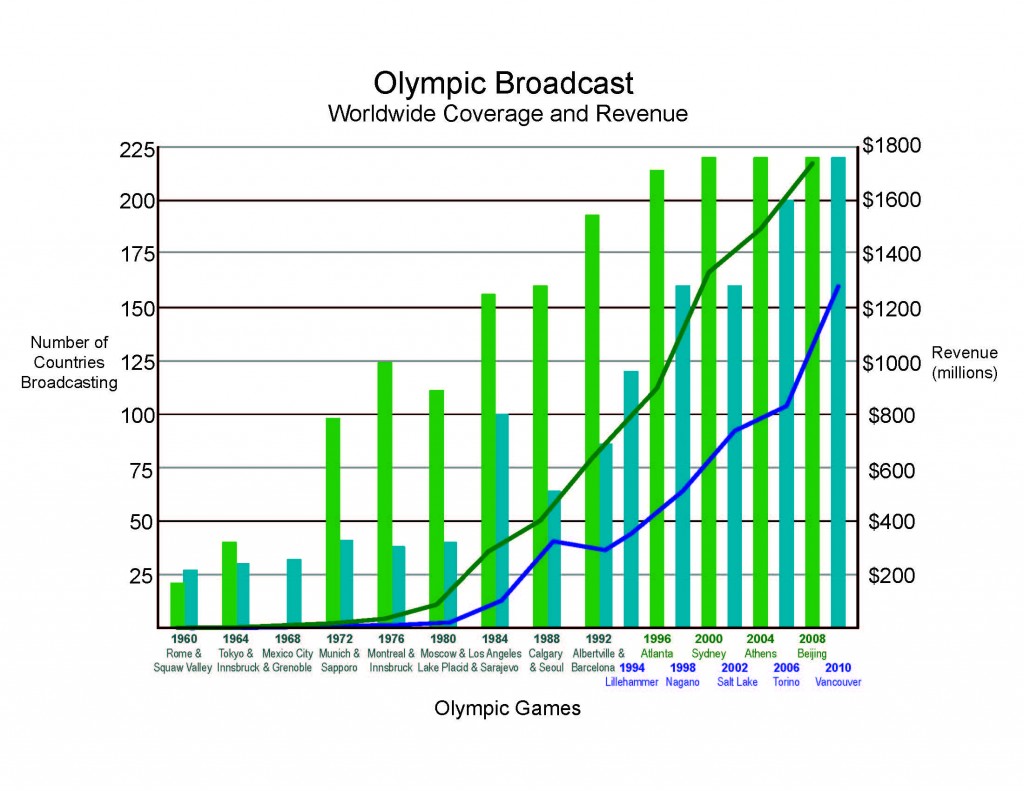
The number of countries broadcasting the Olympics has steadily increased over the past 50 years.  There have been a few blips in lower number of countries during some years but overall there is a very visible upward trend.  This is mostly likely due to the advances in technology in counties over time, enabling them to receive and cable companies able to afford to buy the rights to broadcast the Olympics.  There is a direct correlation with the number of countries broadcasting and the revenue gained from it.  The is a plateauing of broadcasting counties in the 2000’s most likely due to the fact that most countries have caught up to technology, as well as the wide spread introduction to the internet, enabling more people to view the games online rather than on tv.

http://www.olympic.org/Documents/IOC_Marketing/OLYMPIC_MARKETING_FACT_FILE_2011.pdf


Friday, September 16th, 2011

Olympic Sponsorship

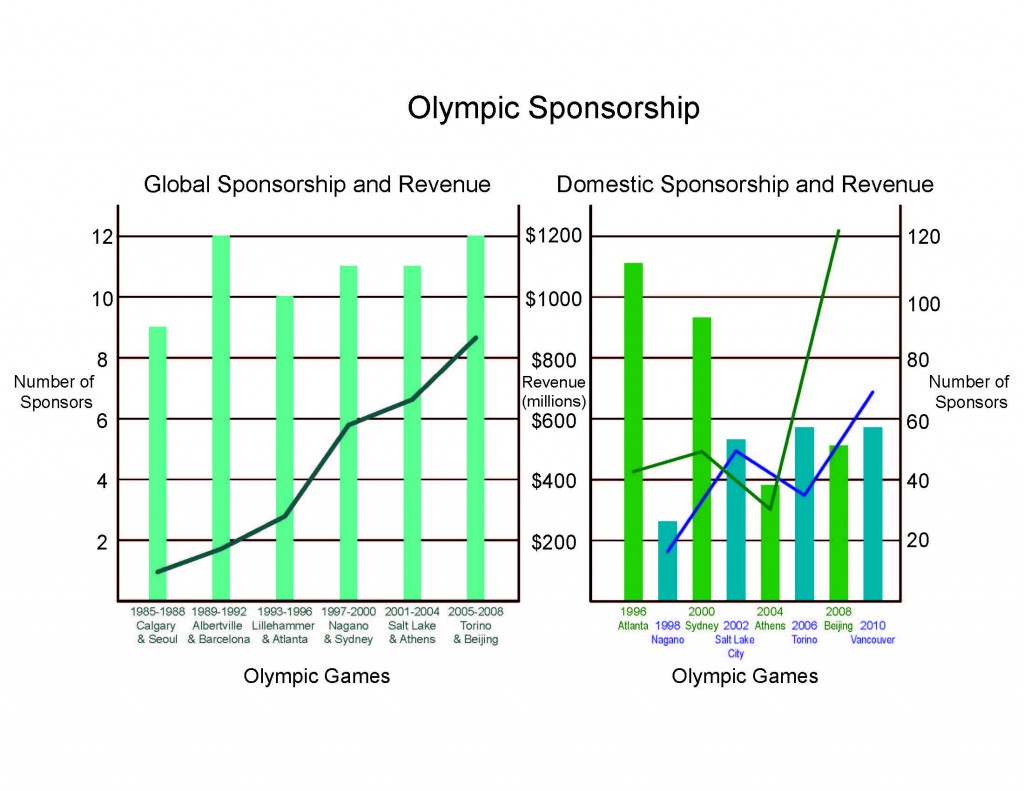
The number of domestic sponsorships sold throughout the years very similarly to that of the ticketing.  There again seems to be a correlation between the number of domestic sponsors and with the size of the hosting country, with the Atlanta games in the US having the highest number of domestic sponsorship.  Unlike the ticketing revenue though, which dropped down less than Athens’s, the domestic sponsorship revenue spikes up for Beijing to $1,218 million, more than double Athens’ with less than half the number of sponsors than Athens.

The number of global sponsorships has stayed relatively the same with minor increases throughout the years.  This is possibly due to the fact that only a select few companies can afford to pay the high global Olympic sponsorship fees in addition to being global enough to benefit for the advertising in all the countries the Olympics are held and broadcasted in.  Even without the change in number of sponsors, the revenue from them has continually increased.

http://www.olympic.org/Documents/IOC_Marketing/OLYMPIC_MARKETING_FACT_FILE_2011.pdf


Friday, September 16th, 2011

Olympic Ticketing

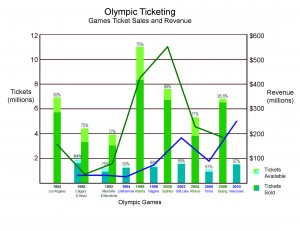
The availability and number of actual tickets sold has fluctuated throughout the years. The number of tickets available seems to have a somewhat close correlation to the size of the hosting country. For example the 2 games in the US, Los Angeles and Atlanta, have high number of tickets compared to the games before and after them such as South Korea, Spain, Australia, and Greece. The Beijing Olympics seem to be a bit of an anomaly with the extremely high population of China but still less tickets than the Atlanta games in the US. As an overall trend the winter Olympics are always smaller than the summer most likely due to the lesser popularity of them. Based on this information, sizes for future Olympic stadiums could be sized relatively based on the size of the population of the host country.

http://www.olympic.org/Documents/IOC_Marketing/OLYMPIC_MARKETING_FACT_FILE_2011.pdf


All content © Copyright 2024 by CLOUD Disassembly RPI.
Subscribe to RSS Feed – Posts or just Comments

Powered by WordPress
Designed by Graph Paper Press