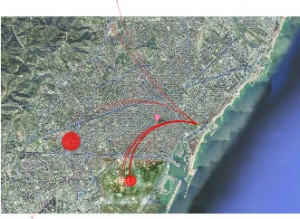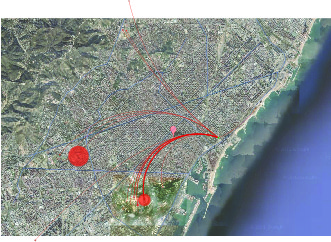
This diagram needs labels…. the red circles are the Olympic venues, scaled in proportion to their seating capacities. The red arcs are all coming from the Olympic Village (which is green, but barely visible) and they are weighted in proportion to the % of athletes traveling to the different venues.
Barcelona is said to have hosted the most successful Olympic Games to date, and the city has been living it up since 1992. This is because the urban development necessary to support the mega-event was distributed in such a way that revitalized the whole city: there were four main zones for the events to take place, one at each entrance to the city. These are all connected by the main ring road, the construction of which was accelerated to completion for the purpose of getting 21,600 members of the Olympic Family (athletes, trainers, event officials, special guests, groupies) where they needed to be on time for every event. Not to mention the several million spectators flooding the city to watch the Games. The strategic placement of the Olympic Village near the waterfront brought back to life a previously derelict urban facade. The beaches had been cut off from the rest of the city by train tracks and highways until preparation for the Games moved these routes underground to open up the coastline.
