Pre-Event Urban Planning

Friday, September 23rd, 2011

Ecology takes back seat to Economy-Sydney’s Toxic Remediation

Leading up to Sydney’s Olympic bid in 1993, they were faced with a difficult decision. What should they do with the potential Olympic park site?  They needed to address the toxic waste that was there from cement and brick making factories over the decades, but they didn’t want to invest too much money if they ended up not securing the bid.


Estimates put full site decontamination around $160 million USD. The removal of all of that dirt off-site would also take more time than Sydney wanted.  The other options were to isolate the contaminated soil into pockets throughout the Olympic site.


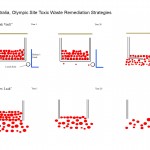
Option 1, known as the Bank Vault trapped the soil through a double liner system. The thought behind this was that the liner would hold for a long time, but once it broke, the toxins would rush into the soil system. This strategy was used near the Aquatics Centre due to its proximity to the creek.


Option 2 involved relocating the toxic material into pockets throughout the Olympic Park. There was an opening at the bottom that allowed for a gradual dispersement of the toxins, with a larger amount being leached sooner, rather than later.


Both options are covered by layers of clean clay soil and landscaped with native plants making visitors oblivious to what is under their feet.


Both options, although more cost effective, costing only $70 million USD, don’t truly address the remediation of toxins on the Olympic site.


Sunday, September 18th, 2011

Investment in the Olympics


The data was all for summer host cities.  If someone finds investment information about any of the games not listed above I’d like to see it please.


The International Journal of the History of Sport

 “A Brief Historical Review of Olympic Urbanization”   by Hanwen Liao and Adrian Pitts

– Excerpt –

Planning in Olympic Host Cities: Successful Olympic Urbanization


A successful Olympic urban scheme seems always to be associated with a suitable and linked long-term master-plan for the host city in terms of project determination, land usage, resource mobilization and development orientation.  Emphasis on such may help to avoid over-ambitious initiatives triggered by infatuated enthusiasm, or any hasty decision-making because of the tight Olympic deadline.  It also helps to rationalize the budgetary deployment so that Olympic projects do not overshadow the development of other essential facilities in the city.


Sunday, September 18th, 2011

Types of Olympic Urban Development

I am still developing this diagram.  If you have any comments or information pertinent to this I’d love to hear it.

The International Journal of the History of Sport

 “A Brief Historical Review of Olympic Urbanization”   by Hanwen Liao and Adrian Pitts

– Excerpt –

Planning in Olympic Host Cities: Successful Olympic Urbanization


A successful Olympic scheme also derives from a holistic planning concept that respects the distinct character of host cities in urbanization conditions, demographic change, socio-economic reality and environmental deficiencies.  This is particularly reflected by the integration of major Olympic facilities into host cities’ urban fabric as fundamental to the overall planning intervention.  Historically Olympic sites have been integrated with cities in six models, with each having different advantages and limitations, and should be used or adapted based on local externalities.

In general, the decentralized model is suitable for a city having good civic infrastructures, with no obvious environmental deficiencies to be redressed in a planning manner, yet a partial adjustment of its urban fabric to balance the holistic development.  Inner-city clustering models are suitable for a city suffering from inner city decline, suburbanization and hence sprawl.  They can help to re-nucleate an even dispersed urban form and introduced large green and public spaces to the city’s central mass.  The periphery clustering model is suitable for cities experiencing a considerable population growth, with outward development pressure and expansion needs.  It can help to define the development orientation and convert an outspread urban form into a linear-shaped transit-oriented form.  The satellite clustering model is suitable for large conurbations where internal development pressures need to be organically dispersed and multi-hierarchy settlements need to be reinforced in the whole region.  The joint clustering model is suitable for the coordination of two closely located developing urban areas for a strategic development.


Saturday, September 17th, 2011

Red Light: Atlanta ’96


An underdeveloped transportation infrastructure led to the unfortunate nickname “the Chaos Games” for Atlanta in 1996.  The Atlanta Olympic Games were approached by private investors with private interests, following the Los Angeles ’84 plan: they wanted to save money wherever they could and maximize their profits, so they used as much existing infrastructure as was available and skimped on a few very important developments, concentrating their money instead in the Central Business District.

The planners underestimated the flow of people that would attend the events, and concentrated most of them in the very center of the city.  Some events had to be moved outside the ring road because they had specific constraints (canoeing, equestrian events, and shooting events) and others took place in sister host cities (Athens, Miami, Orlando) because Atlanta lacked the stadiums to hold them in. (Most of these were american football games)

They relied heavily on the existing four metro lines and a maddening tangle of bus routes to transport the athletes and their supporters to the events.  This crucial time-sensitive passenger load was applied to the system on top of the incoming flow of spectators that took public transportation because they couldn’t park their personal vehicles in the city.  Three separate transport entities had to borrow an additional 2,000 buses from neighboring districts with drivers who weren’t familiar with Atlanta.  They did manage to add HOV lanes to the highways though, so some measures were taken to make the flow move somewhat smoothly.


Saturday, September 17th, 2011

Yellow Light: Tokyo ’64


Stay tuned for maps analyzing the massive transportation infrastructure developments of Tokyo, adequately supported the short-term influx of visitors for the Games as well as the long-term growth of the mega-city over time.


Also, some sort of critique or commentary on the efficiency of Japanese planning strategies, especially those implemented anyway after their original purpose has eroded away.


Friday, September 16th, 2011

Green Light: Barcelona ’92

This diagram needs labels…. the red circles are the Olympic venues, scaled in proportion to their seating capacities.  The red arcs are all coming from the Olympic Village (which is green, but barely visible) and they are weighted in proportion to the % of athletes traveling to the different venues.


Barcelona is said to have hosted the most successful Olympic Games to date, and the city has been living it up since 1992.  This is because the urban development necessary to support the mega-event was distributed in such a way that revitalized the whole city: there were four main zones for the events to take place, one at each entrance to the city.  These are all connected by the main ring road, the construction of which was accelerated to completion for the purpose of getting 21,600 members of the Olympic Family (athletes, trainers, event officials, special guests, groupies) where they needed to be on time for every event.  Not to mention the several million spectators flooding the city to watch the Games.  The strategic placement of the Olympic Village near the waterfront brought back to life a previously derelict urban facade.  The beaches had been cut off from the rest of the city by train tracks and highways until preparation for the Games moved these routes underground to open up the coastline.


Friday, September 16th, 2011

Rio de Janeiro – new methods of transportation in anticipation of the Olympic Games


http://sustainablecities.dk/en/city-projects/cases/rio-de-janeiro-the-gondola-opens-up-the-favela


In terms of public transportation, Rio de Janeiro is facing the same problems as many other Latin-American metropolises. The city is served by a comprehensive public transit system, including a modern metro, suburban trains and a large bus fleet. But transportation services are sometimes unable to keep pace with rampant urbanization, especially when it comes to the favelas. These informal settlements are constructed on steep areas where conventional modes of public transportation cannot be considered. As 20% of Rio’s population is living in a favela, a large part of the population has to do without any public transportation.


Friday, September 16th, 2011

“What are the three main qualities that characterize a sustainable city?”

Joan Busquets Interview

Joan Busquets is a Professor in Practice of Urban Planning and Design at Harvard and the former Head of planning in Barcelona

This is another way you can view the video if the former does not work –

http://sustainablecities.dk/en/actions/interviews/joan-busquets-geography-history-and-diversity-0


Friday, September 16th, 2011

Mapping Olympic sites


This is a great website that shows you were many of the summer Olympic sites are and has images that relate to that site in many cases.  Look to the left hand margin for the different Olympic host cities.


http://www.stadiumatlas.com/


All content © Copyright 2025 by CLOUD Disassembly RPI.
Subscribe to RSS Feed – Posts or just Comments

Powered by WordPress
Designed by Graph Paper Press